This article will explain the various scaling techniques.
Table Of Contents
What are Scaling Techniques
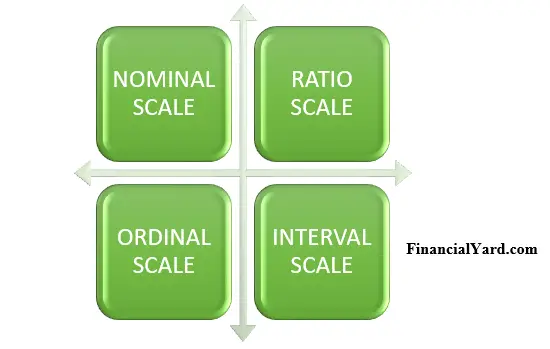
Scaling techniques are levels of measurements that are used by businesses to assess customer satisfaction, preferences and other aspects of the sales process. Organisations use polls, surveys, and questionnaires to conduct market research in order to determine how customers feel about their product or service. The data obtained can be used to identify areas of improvement and to develop better products. Commonly used scaling techniques by business organisations and market researchers are nominal, interval, ordinal and ratio scales. The nominal scale being the lowest and most primitive scale whilst the ratio scale is the most informative measurement.
Nominal Scale
Nominal scales are adopted for non-numeric labelling. This scaling technique is used to measure qualitative data. Observations of a qualitative nature can only be classified and counted with no particular order. A business can divide a country into provinces or cities and when reporting the data there is no natural order or rank assigned to the observations. Any province or city can be reported first or last with no importance assigned to the order. Gender is another example of a nominal scale technique where no gender is regarded more important than the other. If a supermarket wants data on the number of women and men that enter the store, either male or female observations can be reported first.
Ordinal Scale
The ordinal scaling technique is a higher measurement compared to a nominal scaling technique. Data classifications are represented by sets of labels or names that have relative value, meaning that the data classified can be ranked or ordered. With this type of scaling technique one classification is higher or better than the other. On a questionnaire If a customer ticks a product as ‘superior’ it means ‘superior’ is better that ‘good’. If another customer classifies a product as ‘good’ it means that ‘good’ is better than ‘average’ and so on. The order of data has meaning on an ordinal scale where the rating increases or decreases with order. However, the ordinal scaling technique cannot distinguish the amount of difference between groups. That is, on an ordinal scale of ‘superior, good, average and poor’, “good” doesn’t imply twice as “poor” and “superior” doesn’t imply twice as “average”. Also, it is impossible to tell if the difference between “superior” and “good” is the same as the difference between “average” and “poor”. Examples where ordinal scaling techniques can be used is when a company wants to assess how customers rate them in terms of customer service, product functionality or customer satisfaction.
Interval Scale
The interval level scaling technique is a scaling technique which is above the ordinal and nominal scaling techniques. This scaling technique includes all the characteristics of the ordinal scale. What makes the interval scaling technique more superior than the ordinal scale is that the difference between values has meaning, it is a constant size. Temperature is a good example of an interval scale. The temperature figures can be easily ranked, the difference between the figures has meaning and can be determined. The difference between 20 degrees Celsius and 25 degrees Celsius, 5 is the same as the difference between 30 degrees Celsius and 35 degrees Celsius which is also 5. However, zero does not imply the absence of condition on an interval scale. Another example is the standard USA women’s dress sizes where size zero doesn’t mean the absence of material. In addition, an interval scale doesn’t have reasonable ratios. Dividing a dress size 28 by a size 14 doesn’t make sense. However, this scaling technique can help market researchers obtain better comparison between groups and objects.
Ratio Scale
A ratio scaling technique is the highest primary scaling technique. All quantitative data is recorded on a ratio scale of measurement. This scaling technique has the properties of the interval scale and ordinal scale. The zero point and the ratio between measurements is meaningful. Examples of ratio scale measurements are wages, distance and money. Zero dollars mean the absence of money and $4 is two times $2. A ratio scaling can be used to asses income levels of potential customers in order to determine their spending power.
Other types of Scaling Techniques
Comparative scales
Comparative scales are used to compare two or more variables. There can be paired comparisons where a customer selects one out of two options or products, this scaling technique is normally used at the time of product testing. It can also be applied when comparing more than 2 products.
Rank Order
This is a type of comparative scaling technique which can be used to asses consumer preferences over different products or services. A customer can be asked to rank these products according to his/her preference, liking, importance or effectiveness.
Constant Sum
This is a comparative scaling technique where a sum of units such as dollars or points are allocated to product features or attributes. For example, a customer can be given a computer and asked to divide 100 points to each feature based on how s/he rates them. If one feature is not important then the customer can assign zero, if one feature is more important than another feature then the customer can assign twice as much to that feature. The sum of all the points should add up to 100.
Q-Sort Scaling
This type of scaling technique is a rank order technique where customers can be asked to sort products into piles or sets, of 11 usually, depending on a given criteria. Normally the number of products or any object that is to be ranked should be between 60 and 140. This scaling technique was developed to facilitate a quick discrimination among a large number of objects or products. Normally, cards are used to indicate the product to be ranked. For example, a firm can ask its customer to rank 15 different flavours of fruit juice based on sweetness, the flavours can be written on cards for simplicity. The customer can then be asked to place these cards on 3 piles ranging from ‘sweetest’ to ‘sweet’ as shown below;
Q sort scaling example; (3 piles)
| SWEETEST | Apple | Orange | Banana | Grape | Passion Fruit | Pineapple | Mango | Guava |
| SWEETER | Cherry | Raspberry | Plum | strawberry | Grape | |||
| SWEET | Peach | Lime | ||||||